
Understanding rate of return
Understanding rate of return
Understanding rate of return

07.03.2024
When you’re investing, one of the most important pieces of information you’ll want is your rate of return, which is the percentage change of the value of an investment, either a gain or a loss. This figure can help you gauge how well your investments are performing, both overall and when compared to other investments.
While calculating an investment’s rate of return is simple, there are other things to consider, including the different returns on different types of investments, the drawbacks of using the rate of return, and alternative ways of calculating the success of your investments.
Understanding a rate of return (RoR)
Rate of return is a measure used to evaluate the performance of an investment. It’s the gain or loss of an investment over a certain period, often a year. It’s represented as a percentage of the original investment value. It can be used to measure any type of investment, including stocks, bonds, real estate, and more.
The rate of return is an important tool you can use when assessing various investments. An asset’s past rate of return can be an indicator of its future success. When you’re building your portfolio, it’s important to compare rates of return among similar assets to identify the best opportunities.
In many cases, investors may also have a required rate of return, which is a minimum return they are willing to accept on a particular investment. Having a required rate of return in mind ahead of time can be a helpful benchmark and can help you quickly narrow down which investments will provide an acceptable return.

How well are your investments performing?
Analyze your portfolio in minutes and receive a target allocation for your goals.
The formula for RoR
To calculate the rate of return of an investment, you must subtract the asset’s value at the beginning of the period from its value at the end of the period, divide that number by the beginning value, and multiply that number by 100.
Here’s what that formula looks like:
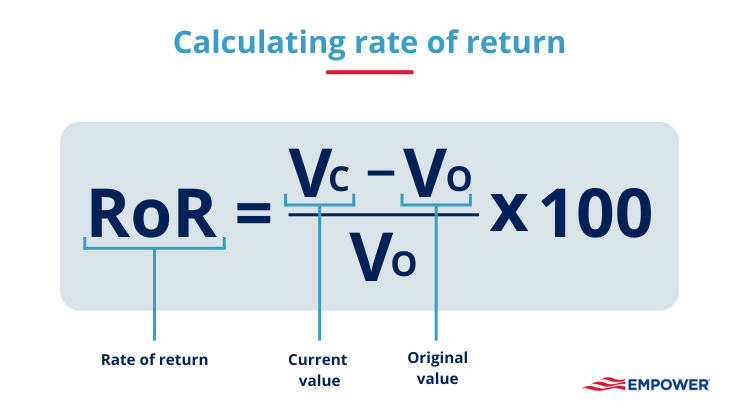
In this calculation, the current value is the investment's value at the end of the period, while the initial value is its value at the beginning of the period. For example, if you invested $1,000 and wanted to know your rate of return one year later, your initial value would be $1,000.
Other names are also used to describe this formula, including the basic growth rate and the return on investment (ROI). While one term may be more likely to be used in a certain setting, they all describe the same thing.
The formula for rate of return is especially helpful when you’re comparing multiple investment options to choose the best one. By running the numbers and comparing the rates of return of multiple investments, you can quickly see which has the best historical returns (which could be — but isn’t guaranteed to be — an indicator of better future returns).
Example of RoR
Suppose you’re selling your home and want to calculate your rate of return. Suppose you purchase the home for $250,000 and you sell it six years later for $335,000. To calculate the rate of return, simply plug the numbers into the formula above:
Rate of return = ($335,000 - $250,000) / $250,000 x 100
When you run the numbers, you find that your rate of return is 34%. Of course, this number on its own doesn’t tell you much. However, you can compare it to either the average increase in home values over the same period or the rate of return of your other investments to determine whether the home was a good investment.
If you compare the rate of return of your home to other investments, make sure you’re using the same period. When you calculated the rate of return of your home, you did so over a six-year period. If you compare it to other investments, make sure to use the same six-year period.
The example above shows a positive rate of return, but a rate of return can also be a negative number if an investment loses money. Suppose that instead of selling your home for $335,000, you sell it for $187,500. If you redo the formula using the new sale price, you’ll find that your new rate of return is -25%.
RoR on stocks and bonds
You can calculate the rate of return of any investment, but the formula is frequently used to calculate the return of traditional assets like stocks and bonds. However, the calculation for these two investments is a bit different because they make money in different ways.
If you’re calculating the rate of a return on a stock that doesn’t pay dividends, you can simply use the RoR formula to find the difference between the ending and beginning value of the investment, divide it by the beginning value, and multiply by 100. For example, if you purchase a stock for $60 per share and sell it five years later for $80, your rate of return is 33%.
However, suppose you’re calculating the rate of return of either a dividend-paying stock or a bond that pays interest. In that case, you must account for both the increase in the asset’s value and other income from either dividends or interest.
For example, in our stock example above, let’s say that in addition to increasing by $20 per share in value, your stock also paid out $10 per share in dividends. That brings your total increase in value from $20 per share to $30 per share and brings your rate of return to 50%.
Similarly, if you’re calculating your rate of return on a bond that paid interest, you must account for both the increased (or decreased) value of the bond itself, as well as any interest it paid.
For example, suppose you purchased a bond for $1,000 and later sold it for a premium of $1,100. The bond also paid $100 in interest during the time you owned it. When you calculate the rate of return, your current value should include the price you sold the bond for and the interest you earned — a total of $1,200. By using that figure in your calculation, you’ll find a rate of return of 20%.
Read more: What is an interest rate?
While the rate of return can be a helpful tool to assess potential stock and bond investments, it shouldn’t necessarily be used to compare stocks to bonds. These two assets serve different purposes in a portfolio.
Stocks often have higher long-term returns, but also higher risk. Bonds, on the other hand, often have a lower total return but have a lower risk, as well as a recurring source of income in the form of interest. It may be more helpful to use the rate of return to compare one stock or bond to another investment of the same asset class.
Real rate of return vs. nominal rate of return
While the rate of return on an investment can be a useful analysis tool, it doesn’t necessarily tell the entire story. The simple rate of return we’ve already discussed is known as the nominal rate of return. A key component missing from the nominal rate of return is inflation, which reduces the purchasing power of your money over time. For example, if you earn $1,000 from an investment five years from now, it won’t have the same value as $1,000 today.
That’s where the real rate of return, also known as the inflation-adjusted rate of return, comes in. The real rate of return adjusts the rate of return for inflation. For example, if your nominal rate of return on an investment is $10 but inflation increased by 3% during that period, your real rate of return is only 7%.
Calculating the real rate of return is especially important when calculating the long-term return on your assets, such as those you’re saving for retirement.
Suppose you invest $100,000 in a retirement account and are invested in stocks of relatively large companies based in the United States, as represented by the S&P 500® Index (S&P 500). The average annual stock market return for the S&P 500 has been just over 10% over the past several decades.1 Assuming a return of 10%, your account balance would grow to more than $1.74 million in 30 years.
However, the average returns for the S&P 500 are closer to 6% or 7% when accounting for inflation. If you assume a 3% average inflation rate, then your real returns over the same 30-year period would actually be around $761,000. It’s important to note, though, that the “stock market” does not only mean stocks of large, established companies based in the United States. One can invest in companies of many different sizes, types of industries, and parts of the world and so on. Each type of investment comes with its own unique risks and return potential ranging from relatively lower risk to very risky.
Past performance is not a guarantee of future results. An index is not actively managed, does not have a defined investment objective, and does not incur fees or expenses. You cannot invest directly in an index.
Read more: Gen Z and money: Five tips for building your net worth
Real rate of return vs. compound annual growth rate (CAGR)
Another way to calculate the return on an investment is by using the compound annual growth rate (CAGR). The CAGR of an investment is its average annual return over a period longer than one year. Rather than showing the total rate of return, it shows an annualized number.
The formula for calculating CAGR is:
CAGR = ((Ending value / Beginning value) ^ 1/n -1) x 100
In this formula, 1/n is the number one divided by the number of years in question. For example, if you’ve held the investment you’re calculating the CAGR of for five years, the “n” would be replaced by the number five.
Calculating the CAGR can be more useful than the rate of return or real rate of return because it makes it easier to compare the performance of multiple investments. For example, if you’re considering investing in a mutual fund, you could use the CAGR to compare that mutual fund to the S&P 500. The CAGR doesn’t show you the actual rate of return for each year, but an average annualized rate based on the total return.
An important difference between the real rate of return and the CAGR is that the CAGR doesn’t account for inflation, while the real rate of return does.
Internal rate of return (IRR) and discounted cash flow (DCF)
Another important consideration for calculating an investment's return is the internal rate of return (IRR) and the discounted cash flow (DCC).
DCC is a method of valuing an investment by estimating the present value of its future cash flow. It operates under the assumption that money today is more valuable than the same amount of money in the future. Using estimated future cash flows and a discount rate, the DCC method aims to estimate an investment’s returns after considering the time value of money.
IRR, also known as the realized return or dollar-weighted return, also uses a discount rate. In this case, IRR is the discount rate that makes the net present value of an investment’s cash flows zero. In other words, it means the initial value of an investment is equal to the present value of the future cash flows.
IRR and DCC are important because, unlike CAGR, they both account for the time value of money, meaning the assumption that a dollar today is more valuable than the same dollar in the future.
Both DCC and IRR are complex calculations that individual investors aren’t likely to use when calculating their investment returns or analyzing potential investment opportunities. Instead, they’re more often used by organizations. For example, a company might use a discount rate when evaluating whether to invest in a particular piece of equipment.
Alternatives to the rate of return
As we’ve discussed, there are several alternatives to the simple rate of return, including the real rate of return, CAGR, and the internal rate of return. It’s helpful to understand what each of these figures means for your investments.
As an individual investor, certain rate-of-return alternatives may be especially helpful when analyzing your current and potential investments. For example, while the simple rate of return shows you your overall investment return, calculating the real rate of return will give you a more accurate view of how much your money will be worth in the future. Additionally, CAGR can help you see an annualized average of your overall return, which makes it easier to compare one investment to another.
Finally, because all of these calculations serve different purposes, you can use multiple metrics when evaluating a single investment to get the most comprehensive view. And the good news is there are plenty of online tools that can run the numbers for you so you don’t have to manually complete each calculation.
What are some drawbacks of RoR?
The rate of return is one of the easiest and best ways to analyze an investment, but it has some drawbacks. One of the most important downsides of the rate of return is that it ignores the time value of money. It doesn’t account for the fact that a dollar today is worth more than a dollar tomorrow because of the money you could earn by investing it today. Additionally, it ignores inflation, which further reduces the purchasing power of your money.
The simple rate of return also disregards timing. Unlike the CAGR, the simple rate of return doesn’t necessarily show you an annualized figure. Instead, it shows you your total rate of return over the period, whether that’s one month or five years. This makes it challenging to compare the returns on multiple investments.
Finally, the rate of return has some limitations in assessing investments with intricate cash flow patterns or multiple stages, such as real estate developments or project finance. These limitations can result in misrepresentations in investment returns and the possibility of making flawed investment decisions, especially in the case of complex investments like venture capital or private equity.
What is considered a good return on an investment?
The benchmark for a good return on investment varies based on many factors, including the assets you’re analyzing and the period over which you’re analyzing them.
When people talk about a good return on investment, they’re often referring specifically to the stock market. Of course, stock market returns vary from year to year. In the past decade alone, the S&P 500® Index has seen annual returns as high as 28.88% in 2019 and as low as -19.44% in 2022.2 But rather than looking at each year in a silo, it’s more helpful to look at the average returns over a long period.
The average annual stock market return is about 10% per year but adjusts to 6% or 7% when accounting for inflation. Of course, your actual returns will also depend on other factors, including your asset allocation and your tax liability.
Depending on your situation, your goal may be to achieve an above-average return on investment. This is likely to be the case if you’re a day trader or invest solely in stocks and alternative investments. On the other hand, if you’re investing for a long-term goal like retirement, you’re probably happy to accept the average market returns in exchange for a slightly lower portfolio risk.
Read more: Roth IRA investment returns: How to grow your wealth for retirement
The bottom line
The rate of return on an investment is the percent change of its value over a certain period, whether that change is positive or negative. You can use the rate of return to analyze your current investment portfolio, as well as assess and compare prospective investments to determine which is the best opportunity.
While the rate of return is a helpful metric, it’s important to consider its downsides and whether there are alternatives, such as the real rate of return or the CAGR, which may give a more accurate view of an investment’s performance.
The S&P 500 Index is a registered trademark of Standard & Poor’s Financial Services LLC. It is an unmanaged index considered indicative of the domestic large-cap equity (stock) market and is used as a proxy for the stock market in general.
On average, investments in large cap stocks may be considered more conservative than investments in small and mid-cap stocks, potentially posing less overall volatility in exchange for less aggressive growth potential.
Bond prices generally fall when interest rates rise (and vice versa) and are subject to risks, including changes in credit quality, market valuations, inflation, liquidity, and default. High-yield bonds have a greater risk of default.
1 Investopedia, “S&P 500 Average Return and Historical Performance,” January 2024.
2 Macrotrends, “S&P 500 Historical Annual Returns,” July 2024.
RO3723228-0724


Andrew Hefner, CFM
Contributor
Andrew Hefner is a Senior Financial Professional at Empower. A Certified Financial Manager (CFM®), he is responsible for leveraging the technology at Empower to deliver holistic financial planning to help our clients lead better financial lives.
The content contained in this blog post is intended for general informational purposes only and is not meant to constitute legal, tax, accounting or investment advice. You should consult a qualified legal or tax professional regarding your specific situation. No part of this blog, nor the links contained therein is a solicitation or offer to sell securities. Compensation for freelance contributions not to exceed $1,250. Third-party data is obtained from sources believed to be reliable; however, Empower cannot guarantee the accuracy, timeliness, completeness or fitness of this data for any particular purpose. Third-party links are provided solely as a convenience and do not imply an affiliation, endorsement or approval by Empower of the contents on such third-party websites. This article is based on current events, research, and developments at the time of publication, which may change over time.
Certain sections of this blog may contain forward-looking statements that are based on our reasonable expectations, estimates, projections and assumptions. Past performance is not a guarantee of future return, nor is it indicative of future performance. Investing involves risk. The value of your investment will fluctuate and you may lose money.
Certified Financial Planner Board of Standards Inc. (CFP Board) owns the certification marks CFP®, CERTIFIED FINANCIAL PLANNER™, CFP® (with plaque design), and CFP® (with flame design) in the U.S., which it authorizes use of by individuals who successfully complete CFP Board's initial and ongoing certification requirements.